Fuel Cell Validation: Case Studies – Part 1 – CFD
- Alvaro Filho
- Aug 8, 2024
- 11 min read

Welcome to our special series of technical posts on computational simulations in engineering! Over the course of three parts, we will explore the full complexity of a fuel cell design, validated with real tests, demonstrating the power of CFD (Computational Fluid Dynamics), FEA (Finite Element Analysis) and systemic simulation tools for the integration of a fuel cell into a hybrid vehicle, aiming to solve complex challenges.
The first case study details the multiphysics modeling and CFD simulation of a fuel cell using Simcenter STAR-CCM+ software.
CFD Case Study
This report aims to detail the 3D modeling of a proton exchange membrane fuel cell (PEMFC), seeking to understand the model and validate the approach. In this work, the Simcenter STAR-CCM+ software was used to perform the modeling. Simcenter STAR-CCM+ is a simulation tool that allows the integration of several physics in a single model, such as in the case of a PEMFC where there is fluid flow, heat transfer, chemical and electrochemical reactions.
To validate the model, hardware from a single reference PEMFC was sought, with tests available in the literature.
The fuel cell chosen for model validation was the JRC ZERO∇ CELL (BEDNAREK et al., 2021), a PEMFC with 24 parallel gas channels at the anode and cathode. Its choice was due to the reliability of its source, which is a technical report from the Joint Research Centre (JRC) (Figure 1), which is the science and knowledge service of the European Commission. The JRC is responsible for providing scientific and technical support to European Union policymaking by developing and providing methods, models, and data.
Figure 1 – Excerpt from the Joint Research Centre technical report on the JRC ZERO∇CELL

Font: Adapted by BEDNAREK et al. (2021)
The availability of technical drawings of the cell geometry (Figure 2), the materials used and some conditions of use also favored its choice.
Figure 2 – Technical drawing of the JRC ZERO∇CELL assembly, together with the description of the cell parts
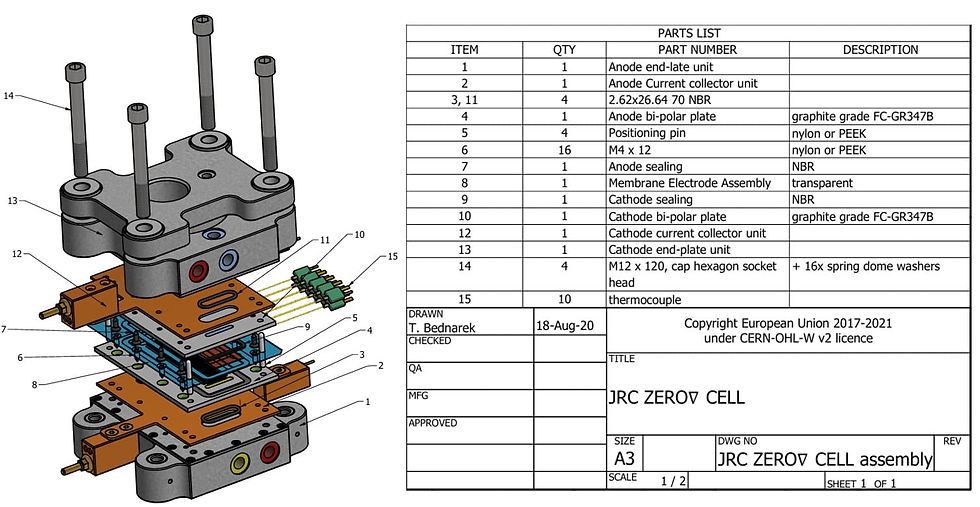
Source: Adapted from BEDNAREK (2021)
Furthermore, the provision of some structural data necessary for the structural analysis stage of the cell was also taken into account.
1 Modeling
This topic will explain and discuss the most relevant points of CFD modeling. The model was developed in Simcenter STAR-CCM+ software, a powerful multiphysics computer simulation software from Siemens.
Briefly, the steps of the CFD study were as follows:
Generation of the complete geometry of the problem;
Adaptation of geometry for CFD analysis;
Selection of physical and chemical models, together with equations;
Generation of the computational mesh (division of bodies into small elements);
Execution of the model and verification of results;
If the results are not consistent, steps two, three and four are reviewed;
If the results are consistent, they are then processed.
Next, the modeling will be divided into topics and further detailed.
1.1 Geometry
The PEMFC geometry (Figure 3) was developed based on the technical drawings of BEDNAREK (2021), referring to JRC ZERO∇ CELL. For the CFD analysis, the focus was on the bipolar plate (BP), gas diffusion layer (GDL), catalyst layer (CL) , membrane and gas passage channels. In addition, small details were removed to simplify the mesh. The changed details were: removal of chamfers on the edges, removal of screw holes and removal of rounded chamfers from the BP channels (Figure 4), through which the gases pass.
Figure 3 – Geometry of the JRC ZERO∇CELL PEMFC drawn in STAR-CCM+ – The leftmost figure shows the complete cell structure; the rightmost figure shows the cathode half of the cell, together with the GDL and the membrane
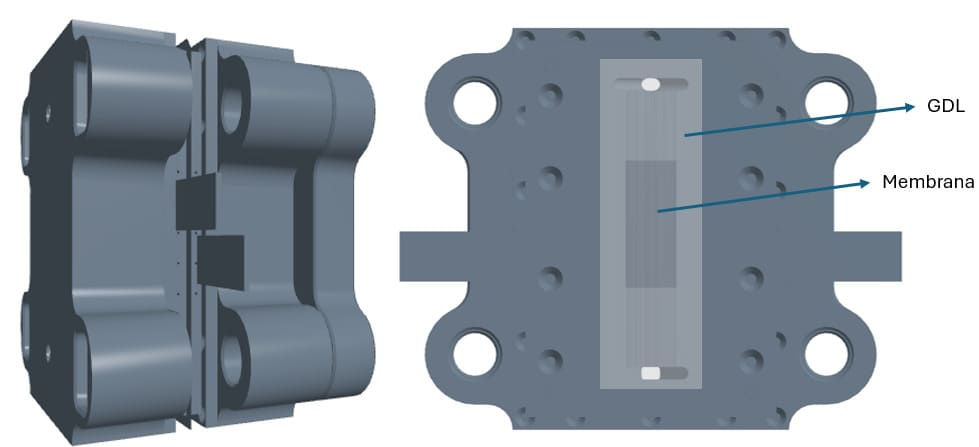
Figure 4 – Representation of BP channels for CFD analysis

Figure 5 – PEMFC with 24 channels – Cathode side

Figure 6 highlights the channels through which the gases pass. For the CFD analysis, only the channels were considered as the volume through which the gases pass.
Figure 6 – PEMFC – Highlighting the gas volume on the cathode side

1.2 Model Physics
In this topic, the physics considered in the model will be discussed, together with the electrochemical reactions. The model was studied in the steady state (without variations in relation to time) and in three-dimensional space.
1.2.1 Bipolar Plate
The bipolar plate's main functions were to determine the path of gases, conduct electric current and generate a difference in electric potential.
The BP (Bipolar Plate) was considered as a solid with constant density, high electrical conductivity of 125,000 S/m and the other physical properties, for example thermal conductivity, as being composed mainly of graphite (as is the case of the BP of JRC ZERO∇ CELL).
Furthermore, the heating generated due to the passage of electric current through the solid (ohmic heating) and electromagnetic effects were considered.
On the extreme surface of each of the bipolar plates (Figure 7), an electrical potential condition was imposed. On the extreme surface of the anode, a potential of 0 volts was maintained. On the extreme surface of the cathode, different values were placed, appropriate to the operational range of the cell, varying from approximately 0.3 to 0.95 volts.
Figure 7 – PEMFC – Anode surface where the electric potential is imposed

1.2.2 Gas Phase
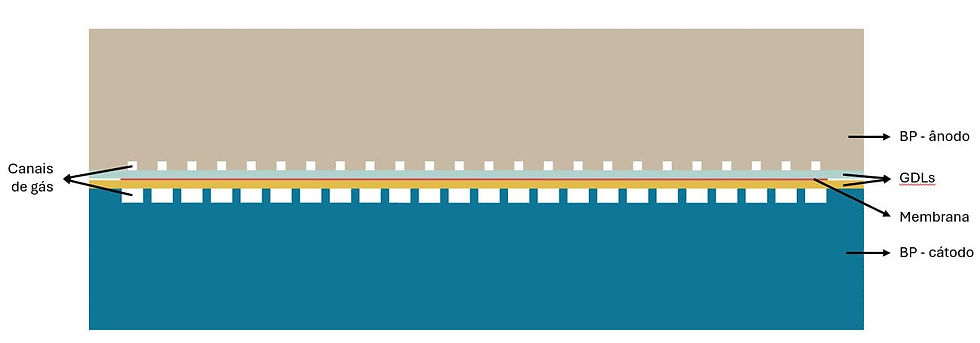
The gas phase flows in the channels generated by joining the BP with the GDL (Gas Diffusion Layer) (Figure 8).
Figure 8 – Channels through which gases flow
The gases in the system were considered to be oxygen (O₂), hydrogen (H₂), nitrogen (N₂) and water vapor (H₂O). The physical properties were considered to be those of the mixture of gases (changing at different concentrations of each gas) and the thermodynamic model of ideal gases was used. In addition, it was considered that the gases flow in the laminar regime.
Regarding electrical conductivity, it was considered that the fluid is non-conductive, adopting a value of 0 S/m.
1.2.3 Gas Diffusion Layer
The GDL (Gas Diffusion Layer) was modeled as a porous region, where anode and cathode gases diffuse into their respective GDLs.
Laminar flow, ohmic heating resulting from the passage of electric current through the porous solid, electromagnetic effects, electrochemical reactions, heating generated by chemical reactions, together with the inertial and viscous resistances of the porous region were considered.
It was also considered that the solid phase of the porous region has electrical and thermal conductivity equal to 50,000 S/m and 24 W/mK, respectively.
Regarding the geometric definition of the pores, 2 parameters were taken into account:
Porosity: is the measure of the amount of empty space (pores) in the porous region, expressed as a fraction of the total volume of the material. In other words, it is the proportion of the total volume of a material that is occupied by empty spaces.
Tortuosity: is the measure of the complexity of the paths that fluids must travel through the pores of the material. In other words, it is the relationship between the actual distance that a fluid travels along the pores and the direct distance (shortest distance) between two points in the porous medium.
According to the reference article (BEDNAREK et al., 2021), the GDL used was the “SIGRACET GDL 25 BC”. According to technical data for this GDL (SIGRACET, 2024), the porosity of the material is 0.8. In the model studied, porosity and tortuosity values consistent with those found in the literature were used. The idea was to verify the influence of porosity and tortuosity on the model and to adapt the experimental polarization curve to the numerical one.
1.2.4 Catalyst Layer
The porous CL (Catalyst Layer) is assumed to be infinitely thin and is not geometrically resolved. The anodic and cathodic reactions are represented by two-dimensional electrochemical reactions, which occur at the interface surface between the proton exchange membrane and the gas diffusion layers. In other words, an infinitely thin catalytic layer (platinum in the vast majority of cases – such as the JRC ZERO∇CELL) is assumed to be present at the interfaces between the GDLs and the membrane.
An electrochemical reaction model was used to simulate the potential variations at this reaction interface. The production and consumption of multicomponent gases due to electrochemical reactions are automatically calculated.
1.2.4.1 Reactions
Hydrogen is supplied to the anode, where it diffuses into the GDL. When the hydrogen reaches the interface with the membrane, where the catalyst is located, it reacts, splitting into hydrogen ions (protons) and electrons (Equation 1). This is the main reaction that occurs at the anode.

Electrons travel from the anode to the cathode through an external circuit, while hydrogen ions pass through the proton exchange membrane from the anode to the cathode.
Oxygen is supplied to the cathode, where it also diffuses into the GDL. In the presence of electrons, oxygen forms oxygen ions. Hydrogen ions and oxygen ions react at the interface of the cathode GDL with the membrane, forming water and releasing heat. The overall cathodic reaction is described by Equation 2. The anodic and cathodic reactions complement each other by consuming and producing ions and electrons in a conservative manner.

Anodic and cathodic reactions complement each other by consuming and producing ions and electrons in a conservative manner.
The reaction current on the anode and cathode sides of the fuel cell is calculated using the Butler-Volmer equation, which considers several factors to determine the electrochemical reaction rate.
The exchange current density at the electrode is a variable parameter, which depends on the materials used in the GDL and membrane, together with the type and concentration of catalyst in each of the CLs. Therefore, this parameter was adjusted in order to adjust the polarization curve of the model with the experimental polarization curve.
1.2.5 Membrane
The anode and cathode are separated by a polymeric membrane, such as Nafion. Nafion is composed of long polymeric molecules with functional cations in their chains. The cations present in the chains are responsible for absorbing protons and water for transport through the membrane. Thus, the proton exchange membrane in this model is modeled to replicate the properties of Nafion, which allows the movement of positive ions through its pores.
The membrane was modeled as a solid material using a solid ion model, which allows the transport of ions through the membrane geometry. Constant density, heating due to chemical reaction, ohmic heating, and electromagnetic effects were considered.
1.3 Boundary Conditions
Boundary conditions in a computer simulation are definitions that specify the behavior of fluid and solids at the boundaries of their domains. Boundary conditions provide the information needed to define how the fluid enters, exits, and interacts with surfaces within the simulation domain, along with the behavior of solids.
As inlet conditions for the anode and cathode gases, the operating conditions provided in BEDNAREK et al. (2021) were followed (Figure 9).
Figure 9 – JRC ZERO∇CELL operating conditions
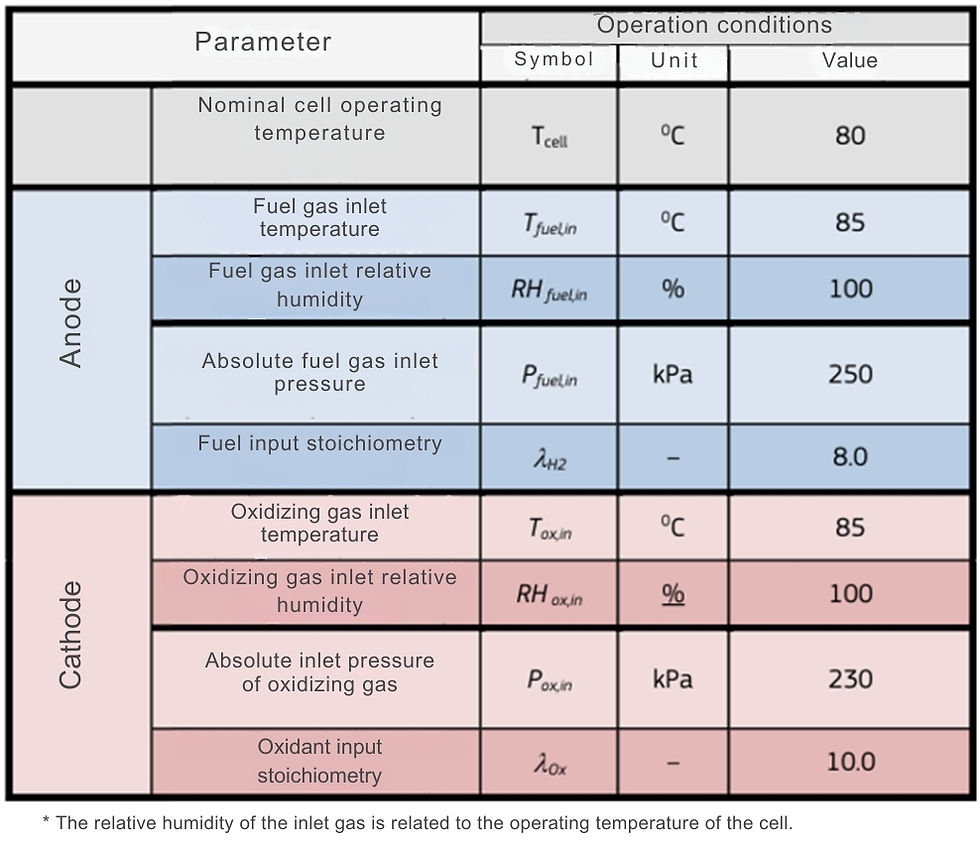
Font: Adapted by BEDNAREK et al. (2021)
Where the anode gases are composed of H₂ and H₂O and the cathode gases are composed of air (considered as approximately 22% O₂ and 78% N₂, in mass percentages) and H₂O.
As already mentioned, on the extreme surface of each of the bipolar plates (Figure 7), the electrical potential conditions were imposed. Where, on the surface referring to the anode, a potential of 0 volts was maintained; and on the surface referring to the cathode, different values were placed, appropriate to the operational range of the cell, varying from approximately 0.3 to 0.95 volts.
It was considered that the cell walls, with the excess of the surfaces where electrical potential conditions are placed, are thermally isolated from the external environment. Therefore, the only cooling that the cell has is that of the flow of reactant gases itself. On the surfaces that are not adiabatic, a fixed temperature value equal to 85°C was considered, the gas inlet temperature of the JRC ZERO∇CELL.
2 Results
As results, the temperature profile, the pressure profile and the polarization curve can be highlighted.
2.1 Temperature
To analyze the temperature, the cathode electrical potential was set at 0.52 V. As a result, we have the temperature at the ends of the BPs (Figure 10), where it can be observed that the temperature remained constant and with the value of 85°C, a temperature that was imposed at the end with the largest area. This behavior is expected due to the proximity of the side walls to the imposed temperature condition.
Figure 10 – Temperature at BP
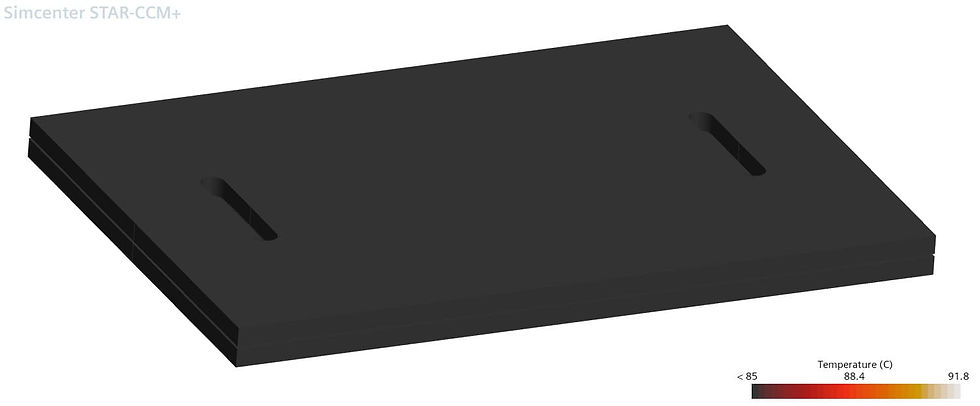
Figure 11 and Figure 12 represent the temperature in two different cutting planes, showing the heat generation with the chemical reaction.
Figure 11 – Temperature in BP cutting plane

Figure 12 – Temperature in BP cutting plane
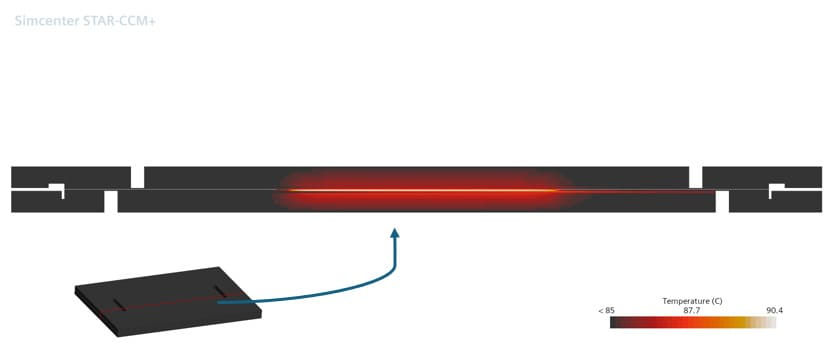
These cell temperature representations show the importance of adequate cooling. The 85°C condition, as expected, was not sufficient to maintain the cell core at its ideal operating temperature of 80°C.
2.2 Pressure
Figure 13 represents the pressure at the anode gas inlets and outlets. The blue channels (lower pressure) represent the gas outlet surface; the red channels (higher pressure) represent the gas inlets. This shows a pressure drop of approximately 8 kPa.
Figure 13 – Pressures at channel inlets and outlets
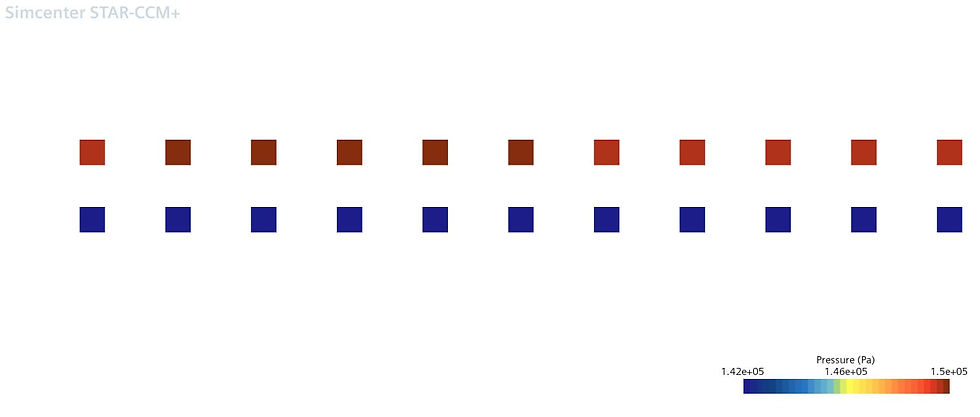
Figure 14 represents the pressure at the cathode gas inlets and outlets. The blue channels (lower pressure) represent the gas outlet surface; the red channels (higher pressure) represent the gas inlets. This shows a pressure drop of approximately 4 kPa.
Figure 14 – Pressures at channel inlets and outlets

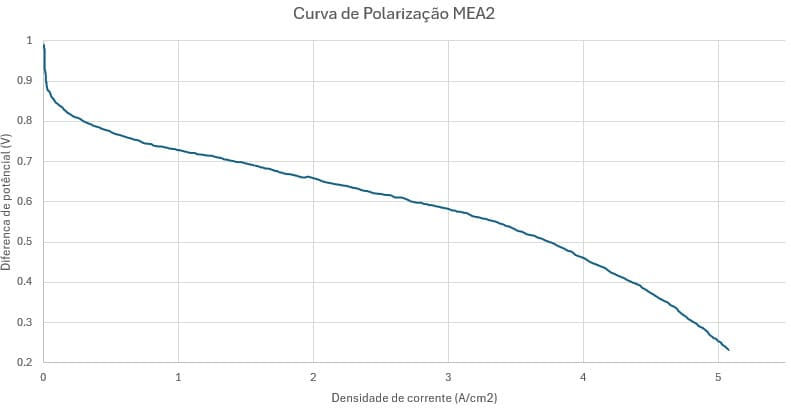
2.3 Polarization Curve
The polarization curve consists of a plot of current density versus cell voltage, where current density is the cell current divided by its active area (membrane area).
The reference article (BEDNAREK et al., 2021) provides the polarization curve (Figure 15) for the cell studied (in Figure 15 it is a constant blue line curve). An extraction of the points from the curve (Figure 16) was performed to enable comparison with that generated by the model.
Figure 15 – Polarization curve of the JRC ZERO∇CELL

Figure 16 – Generation of the polarization curve by extracting the points from the JRC ZERO∇CELL polarization curve
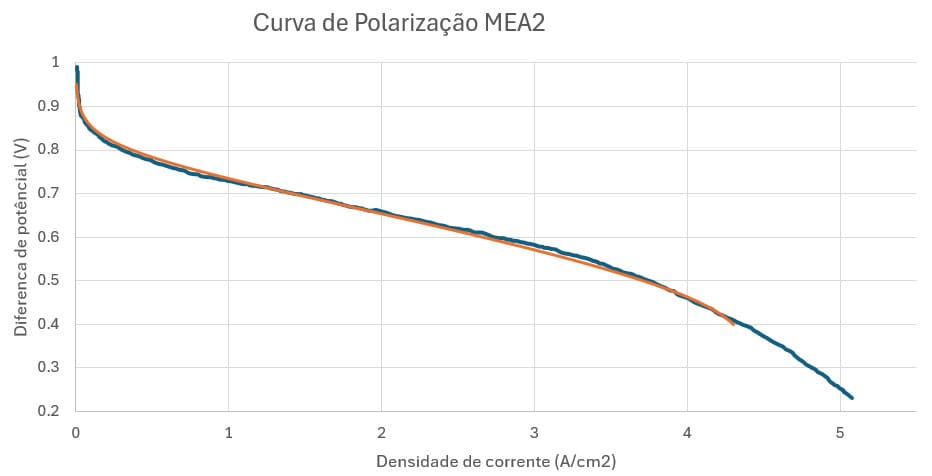
Therefore, the values of the exchange current density at the anode were adjusted to 4.125*10⁸ A/m² and the exchange current density at the cathode to 1792.5 A/m² in order to adjust the polarization curve generated by the model with the reference curve. The porosity was set to 0.8, according to the real value of the porosity of the GDL used. Thus, the polarization curve shown in Figure 17 was obtained.
Figure 17 – Comparison of the reference polarization curve (in blue) and the one calculated by the model (in orange)
3 Conclusion
With this project, it was possible to accurately digitally reproduce the PEM fuel cell model, demonstrating the ability of Simcenter STAR-CCM+ to work with complex multiphysics simulations and obtain physical results consistent and accurate with those observed in the real world. In this work, the STAR-CCM+ model proved to be validated and efficient for this purpose.
Despite the possibility of performing co-simulations with Simcenter AMESIM, due to the high computational cost of modeling in STAR-CCM+, the best alternative is to use the polarization curve, electrochemical data and geometric parameters of the cell obtained by CFD simulation in AMESIM. This way, the analysis will be faster. In this way, the optimization of computational resources is guaranteed without compromising the accuracy and reliability of the results obtained in the simulations. Thus, it will be possible to predict the influence of changes in geometric or process parameters quickly and with better cost-benefit, in an innovative way.
Want to know more and in more detail? Schedule a meeting with us now or contact us through one of our means of communication! In the next post we will present the structural analysis of the fuel cell in Simcenter 3D, based on the integration of the results obtained in STAR-CCM+!
WhatsApp: +55 (48) 98814-4798
E-mail: contato@caexperts.com.br
4 References
BEDNAREK, Tomasz et al. Development of reference hardware for harmonised testing of PEM single cell fuel cells. 2021.
BEDNAREK, Tomasz (2021), “The JRC ZERO∇CELL design documentation”, Mendeley Data, V1, doi: 10.17632/c7bffdv7yb.1
SIGRACET. GDL 24 & 25 Series Gas Diffusion Layer. Fuel Cell Store. Disponível em: <https://www.fuelcellstore.com/spec-sheets/SGL-GDL_24-25.pdf>. Acesso em: 23 maio 2024.
5 Additional References
BEDNAREK, Tomasz; TSOTRIDIS, Georgios. Assessment of the electrochemical characteristics of a Polymer Electrolyte Membrane in a reference single fuel cell testing hardware. Journal of Power Sources, v. 473, p. 228319, 2020.
BEDNAREK, Tomasz; TSOTRIDIS, Georgios. Comparison of experimental data obtained using the reference and the single-serpentine proton exchange membrane single fuel cell testing hardware. Data in Brief, v. 31, p. 105945, 2020.
Comments